Bitcoin structure check: a correction inside an uptrend
También disponible en español →
The market moment for Bitcoin this week is a correction inside an uptrend. The read comes from two degrees of structure, weekly and daily, the same engine behind the market moment alerts on the site, and it covers the stretch from the next seven days to the next thirty. Longer than that is a different conversation.
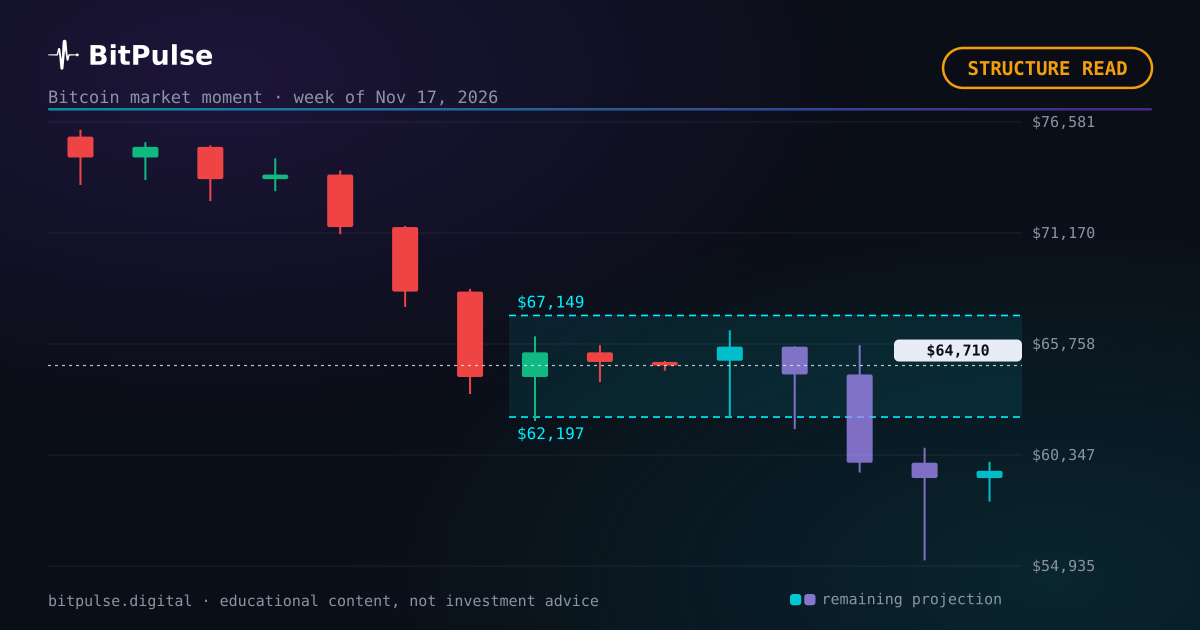
The two-degree read on Bitcoin right now
The read here uses two degrees of structure, the same ones behind the market moment alerts in the app. The higher degree runs on weekly candles and it is pointing up: its last confirmed pivot was 20 weeks ago and price has moved +12.0% since. The lower degree runs on daily candles and points down, 27 days after its own turn.
The two degrees disagree right now: the weekly trend points one way and the daily structure is moving against it. That is the textbook shape of a correction inside a larger trend, and it resolves either by the daily degree turning back or by the weekly one giving in.
Last week, same series: Where Bitcoin stands this week: a correction inside an uptrend. That range is already settled and published, hit or miss.
The range comes out of a four-model engine, reweighted every week against the real record. How it is calculated, step by step.
The week ahead, in numbers
For the next seven days the projection line sits around $65,918, with the pessimistic-to-optimistic scenarios spanning $59,806 to $72,239. Those are the same numbers drawn on the live chart, recalculated daily, so they will drift as the week plays out.
Context for the week: realized volatility sits at the 43th percentile of its history, and the market risk index reads 29 out of 100. Neither quiet nor stormy: a middling tape.
The thirty-day frame
Context first, verdict after. Stretching to thirty days, the projection line sits around $64,163 and the scenarios open up to $49,987 to $81,675. The band widens with time on purpose: a month of Bitcoin carries real uncertainty and pretending otherwise is how forecasts embarrass their authors.
This piece deliberately stops at one month. Beyond that, structure reads decay into noise and the useful tools change: cycle position, halving distance, the long projection. Those live on the site, recalculated daily.
Sentiment is at an extreme, which is worth noting
Now the part most readers skip. The Fear and Greed index prints 12 this week (extreme fear). It only earns a mention here when it pins an extreme, and this is one of those weeks. Extremes do not time anything by themselves; what they do is mark when the crowd has already leaned hard to one side.
The uncomfortable pattern, repeated across cycles: the index spends its best buying days deep in fear and its worst ones deep in greed. It is a mirror of the last move, not a window into the next one.
The cycle clock, for context
For the longer frame: this is day 942 since the April 2024 halving, and the next halving is estimated by block height around February 9, 2028. Cycle position does not decide what next week does, but it sets the base rates: the same daily candle reads differently at day 200 than at day 942.
Words like accumulation and capitulation belong to this clock, not to any single week. They are called with hindsight, from structure and time together, which is why this piece reports the structure and lets the labels wait.
The track record this range joins
One layer deeper. 8 of the 12 projected weekly ranges published so far resolved inside the band. Every one of them was frozen before its week, and every result went up afterwards, including the ones that went wrong.
There is a trap in that number worth naming. A band that contains the close every single time is not a good model, it is a wide one. The published band is the middle half of the distribution, so a properly calibrated engine should land inside about half the time. A hit rate far above that means the bands are wider than they should be, which is a miscalibration too, just the flattering kind.
The daily move is fighting the weekly one
Zoom out for a second. The current shape is a correction: the weekly structure still points up, while the daily one is moving against it, -23.8% from its last turn. Corrections are how trends breathe, and most of them end with the larger degree reasserting itself.
The honest caveat: every reversal in history started life looking exactly like a correction. The tell is in the weekly pivots, and that is a matter of weeks. Within the next month, watch whether the daily degree turns back in line or keeps carving lower pivots against the trend.
The next number is already live
The next projected range is drawn over the live Bitcoin chart in the app, alongside the dated zones for the longer horizons, and it is recalculated on the server every day so that every visitor sees the same numbers. Nothing here is computed in your browser and nothing is personalised.
None of this is investment advice. It is one statistical model keeping its numbers where anybody can check them, including the weeks it gets wrong.
What is on the calendar
- Fed meeting minutes
The projection does NOT use this data. We measured it: a macro release moves Bitcoin by one or two points over ten days, while Bitcoin’s own swing over that same window is close to thirteen. It drowns, so adding it would decorate the model rather than improve it. This is here as context.
Frequently asked questions
What is the Bitcoin market moment?
A read of where price sits in the movie: an up or down phase, a correction inside a larger trend, a directionless market, a fresh reversal or an extreme of the projection cone. It comes from two degrees of structure, one on weekly candles and one on dailies, the same engine behind the market moment alerts in the app. This week the read is a correction inside an uptrend.
How is the Bitcoin range calculated?
With a combined engine of four models: a power law over a decade of price history, a Monte Carlo simulation driven by GARCH volatility, an Ornstein-Uhlenbeck residual model and an implied density read from the Deribit options surface. They are pooled into one distribution and reweighted every week against real history, with around fourteen live data sources feeding a bias layer on top. The published band is its middle half, frozen before the period starts so it cannot be adjusted after the fact.
Where can I see the full track record?
On the results page, with every checked projection, hits and misses alike. This piece's range, $NaN to $NaN, ends up there too.
Published before the fact
Bitcoin dominance: – · Altseason: –
The 7, 30 and 90-day zones are checked on the free account; from six months to three years belongs to Pro. See the plans →