Bitcoin midweek: $78,832, inside the range
También disponible en español →
Midweek, the scoreboard reads: price $78,832, committed range $76,127-$80,373, 3 days left. So far the range holds.
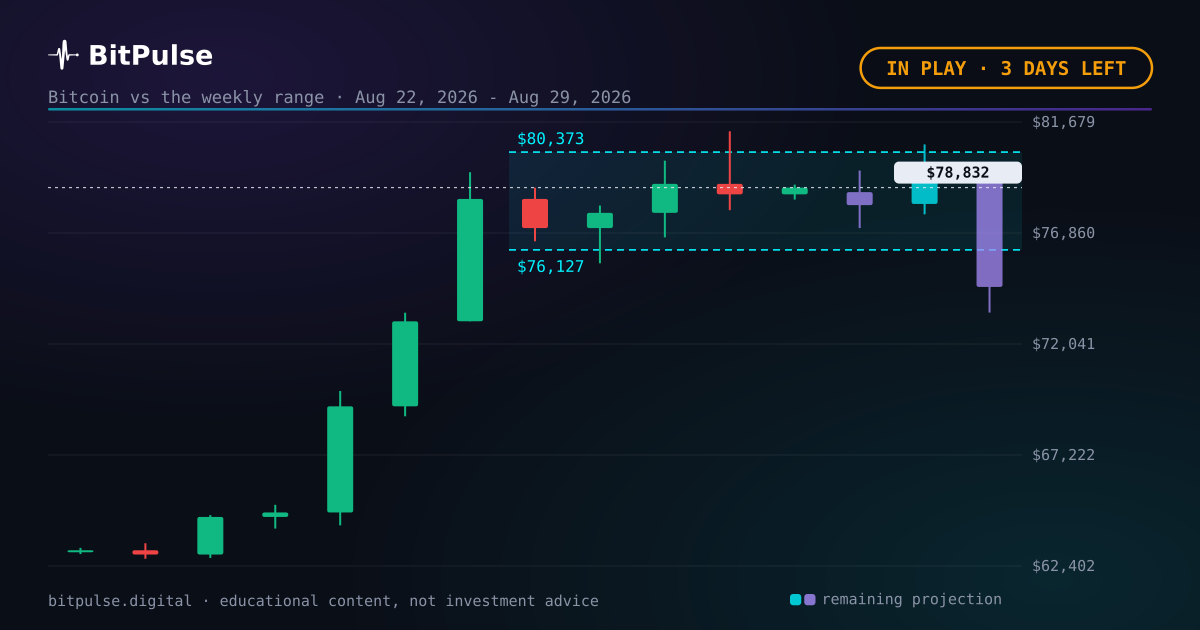
Where price sits with the week half played
Since the week opened, Bitcoin has moved +2.3% and trades at $78,832 against the committed band of $76,127 to $80,373. Inside the band, that puts price at roughly the 64% mark of its width.
There are 3 days left before the range resolves.
Why a midweek reading is only a reading
One layer deeper. Projected weekly ranges resolve against the Bitcoin weekly close of August 29, 2026, not against any midweek print. Weeks have flipped from outside to inside and back again, in both directions.
The midweek check exists for honesty, so the record never shows only the flattering frames. It is the same reason the misses get published: a log you can only read when it is going well is not a log.
The Bitcoin model behind the range
Zoom out for a second. The band is not one forecast dressed up as a range. It comes out of a combined engine of four models (a power law over a decade of price history, a Monte Carlo simulation driven by GARCH volatility, an Ornstein-Uhlenbeck residual model and an implied density read from the Deribit options surface), pooled and reweighted every week against real history. Each one is wrong in its own way, which is the point: pooling them cancels part of the error that any single Bitcoin model carries alone.
Around fourteen live data sources feed the bias layer on top, among them MVRV-Z, SOPR, NUPL, the Puell multiple, Reserve Risk, the Bitcoin realized price, funding rates and global liquidity. What comes out is a distribution of thousands of simulated price paths, and the published band is its middle half, from the 25th to the 75th percentile. Roughly one path in two ends inside it.
A range is not a price target
Search for a Bitcoin price prediction and you will find a single number with a date attached and no way to check it later. This is the other thing. The band from $76,127 to $80,373 says where the model thinks price is more likely than not to land, it says so before the fact, and it gets marked against the real close afterwards.
The distinction is the same one a weather forecast makes. Nobody promises rain at four in the afternoon; they give you a probability and you decide what to do with the umbrella. A Bitcoin price target promises certainty that nobody has. A forecast hands you the odds and keeps the receipt.
Day 859 of the Bitcoin halving cycle
Set the price aside for a moment. Counting days since the April 2024 halving puts this piece on day 859. The next halving is estimated by block height for February 6, 2028, a date that drifts with the real cadence of mined blocks rather than sitting on a calendar.
That count is the honest way to compare cycles, because what matters is not the date but how far in we are. It is also worth saying plainly that four halvings means four cases. Enough to see a shape, nowhere near enough to prove one, and whether the four year cycle still holds is an argument that is very much open. The cycle is context here, never the reason for a weekly number.
Hits and misses, published the same size
6 of the 8 projected weekly ranges published so far resolved inside the band. Every one of them was frozen before its week, and every result went up afterwards, including the ones that went wrong.
There is a trap in that number worth naming. A band that contains the close every single time is not a good model, it is a wide one. The published band is the middle half of the distribution, so a properly calibrated engine should land inside about half the time. A hit rate far above that means the bands are wider than they should be, which is a miscalibration too, just the flattering kind.
The models that are not in here
Context first, verdict after. Worth being explicit, because the most searched Bitcoin models are not in this engine. There is no stock to flow here and no rainbow chart. Both are readable, both are popular, and both have spent the last cycle being argued about precisely because they were published as certainties and then had to be quietly re-drawn.
The power law is in, as one of the four generators, and it earns its place by being reweighted against real history every week rather than by looking convincing on a chart. Leaving the famous models out is not a dig at them. It is the same standard applied here: if a component cannot be scored against what actually happened, it does not get to move the band.
What happens next
Now the part most readers skip. The next projected range is drawn over the live Bitcoin chart in the app, alongside the dated zones for the longer horizons, and it is recalculated on the server every day so that every visitor sees the same numbers. Nothing here is computed in your browser and nothing is personalised.
None of this is investment advice. It is one statistical model keeping its numbers where anybody can check them, including the weeks it gets wrong.
What is on the calendar
- US GDP (preliminary)
The projection does NOT use this data. We measured it: a macro release moves Bitcoin by one or two points over ten days, while Bitcoin’s own swing over that same window is close to thirteen. It drowns, so adding it would decorate the model rather than improve it. This is here as context.
Frequently asked questions
Is Bitcoin inside this week's projected range?
Right now, yes: it trades at $78,832 against the $76,127 to $80,373 band, with 3 days left. Only the weekly close settles the range, not a midweek snapshot.
Is this a Bitcoin price prediction?
No. It is a projected price range: the central band of thousands of simulated scenarios, published before the fact and checked after. Here it covered $76,127 to $80,373. It is educational content and it can fail; it is not investment advice.
How is the Bitcoin range calculated?
With a combined engine of four models: a power law over a decade of price history, a Monte Carlo simulation driven by GARCH volatility, an Ornstein-Uhlenbeck residual model and an implied density read from the Deribit options surface. They are pooled into one distribution and reweighted every week against real history, with around fourteen live data sources feeding a bias layer on top. The published band is its middle half, frozen before the period starts so it cannot be adjusted after the fact.
Published before the fact
Bitcoin dominance: – · Altseason: –
The 7, 30 and 90-day zones are checked on the free account; from six months to three years belongs to Pro. See the plans →