The Bitcoin week, settled: +23.0%
También disponible en español →
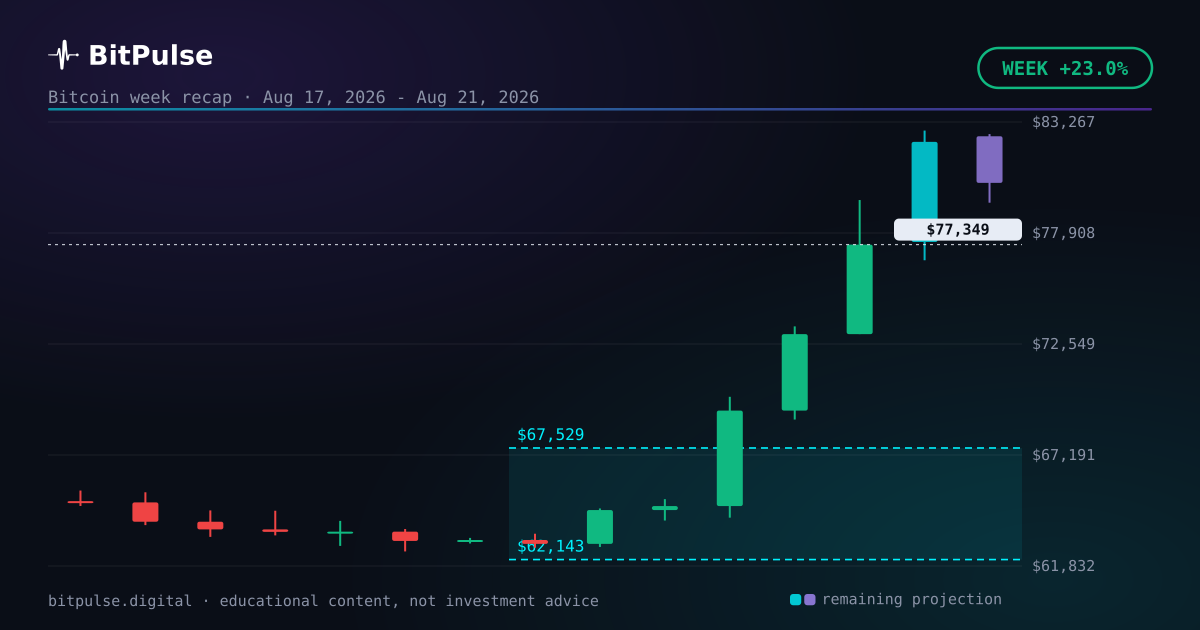
Every Friday night this recap settles the Bitcoin week while it is still fresh: how it opened, what each day did, where price stands tonight and how close the committed projection got. This week: from $62,900 on Monday to $77,349 tonight, up 23.0%.
How the week actually went
Bitcoin opened the week at $62,900 and goes into Friday night at $77,349: up 23.0% on the week. The best day was Wednesday at +7.1%, the worst was Tuesday at +0.3%. The full day-by-day sits in the data box above.
That is the recap's whole job: what actually happened, priced and dated, before the weekend rewrites it into a story. Whatever narrative the timeline settles on, these closes are the part nobody gets to edit.
The committed range, checked against tonight
Context first, verdict after. The committed weekly range said $62,143 to $67,529, frozen before the week started. Tonight's price of $77,349 sits outside it, 14.5% beyond the top edge.
The range does not settle tonight: it resolves at its own expiry, and the verdict gets published either way, like the 6 of 7 weekly ranges before it. This is the midweek-to-Friday photo, not the final whistle.
What the public log says so far
Now the part most readers skip. 6 of the 7 projected weekly ranges published so far resolved inside the band. Every one of them was frozen before its week, and every result went up afterwards, including the ones that went wrong.
There is a trap in that number worth naming. A band that contains the close every single time is not a good model, it is a wide one. The published band is the middle half of the distribution, so a properly calibrated engine should land inside about half the time. A hit rate far above that means the bands are wider than they should be, which is a miscalibration too, just the flattering kind.
Forecast, not prediction, and the difference matters
Search for a Bitcoin price prediction and you will find a single number with a date attached and no way to check it later. This is the other thing. The band from $62,143 to $67,529 says where the model thinks price is more likely than not to land, it says so before the fact, and it gets marked against the real close afterwards.
The distinction is the same one a weather forecast makes. Nobody promises rain at four in the afternoon; they give you a probability and you decide what to do with the umbrella. A Bitcoin price target promises certainty that nobody has. A forecast hands you the odds and keeps the receipt.
The market moment this week belongs to
One layer deeper. Read through the structure engine behind the market moment alerts, this week belongs to an uptrend on both degrees: the weekly degree points up and the daily one up. That is the frame the week's candles were painted inside.
The Tuesday piece digs into that structure in detail. The recap only needs the label: a week means something different inside an uptrend than inside a correction, and pretending weeks float free of context is how recaps mislead.
The next number is already live
Zoom out for a second. The next projected range is drawn over the live Bitcoin chart in the app, alongside the dated zones for the longer horizons, and it is recalculated on the server every day so that every visitor sees the same numbers. Nothing here is computed in your browser and nothing is personalised.
None of this is investment advice. It is one statistical model keeping its numbers where anybody can check them, including the weeks it gets wrong.
Frequently asked questions
What did the Bitcoin price do this week?
It went from $62,900 at Monday's open to $77,349 on Friday night, +23.0%. The best day was Wednesday and the worst was Tuesday; the full day-by-day sits in the article's data box.
How is the Bitcoin range calculated?
With a combined engine of four models: a power law over a decade of price history, a Monte Carlo simulation driven by GARCH volatility, an Ornstein-Uhlenbeck residual model and an implied density read from the Deribit options surface. They are pooled into one distribution and reweighted every week against real history, with around fourteen live data sources feeding a bias layer on top. The published band is its middle half, frozen before the period starts so it cannot be adjusted after the fact.
Where can I see the full track record?
On the results page, with every checked projection, hits and misses alike. This piece's range, $62,143 to $67,529, ends up there too.
Published before the fact
Bitcoin dominance: – · Altseason: –
The 7, 30 and 90-day zones are checked on the free account; from six months to three years belongs to Pro. See the plans →