Bitcoin week in review: $84,754 close misses the published range
También disponible en español →
Every Sunday the BitPulse model commits to a range for the following week, in public and before the fact. The one that just expired said $77,588-$81,672; the market answered with a close at $84,754, outside it.
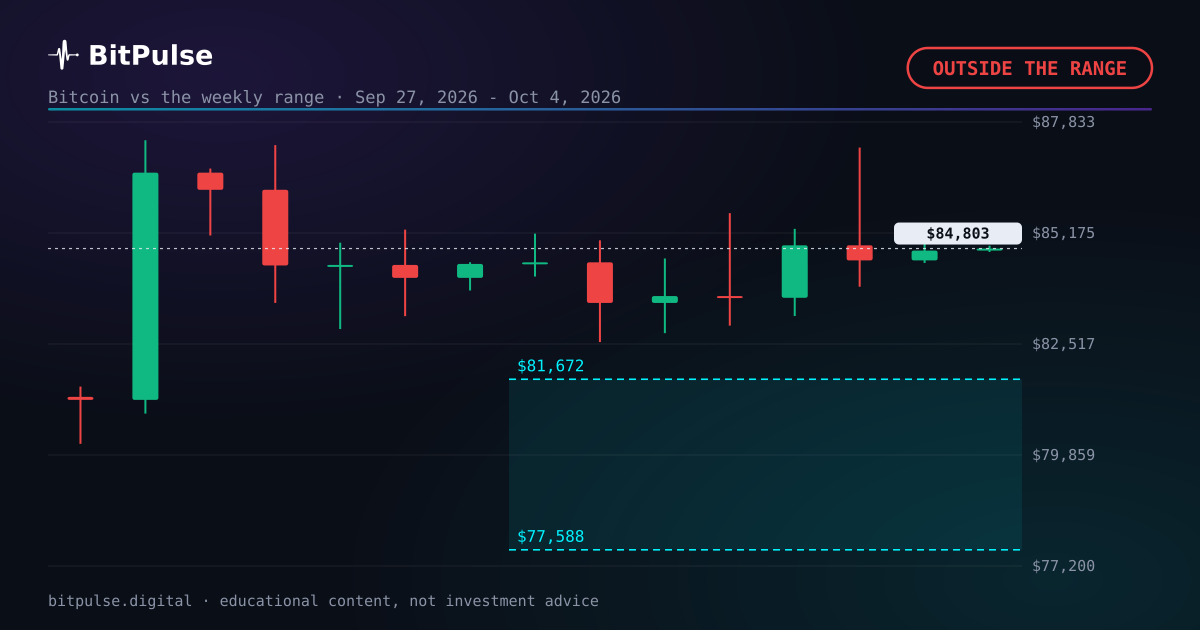
The week, from open to close
Bitcoin traded between a weekly low of $82,563 and a high of $87,220, and finished +0.3% from Monday's open. The number that settles the range is the close, and this week the close was $84,754.
Measured against the centre of the projected band, that landed +6.4% away, with official resolution still pending while the checker validates the close inside its window. The verdict: outside the band.
Last week, same series: Bitcoin week in review: $84,433 close misses the published range. That range is already settled and published, hit or miss.
The range comes out of a four-model engine, reweighted every week against the real record. How it is calculated, step by step.
A quiet week, which is also information
Now the part most readers skip. 0.3% across seven days is a quiet week by Bitcoin standards, and quiet weeks are the ones nobody writes about. They are also the majority of them.
That matters for anyone trying to judge a model, because a forecast only gets tested properly across the boring stretches as well as the dramatic ones. Publishing the flat weeks is how the log stays honest instead of becoming a highlight reel.
The track record, out in the open
Every weekly range on this site is committed in advance and checked against the real close, in public, on the Results page. So far 8 of the last 12 resolved weekly ranges closed inside the committed band. Chance alone would expect about half.
The number is published the same way when it flatters the model and when it does not, because a track record you only show when it looks good is marketing, not a record. Each entry keeps its emission date, its band and the close it was checked against, so anyone can audit any week.
The distance between the high and the low
One layer deeper. Between the weekly low of $82,563 and the high of $87,220 there is 5.6% of ground, and the close ended 2.8% below the top of that span. The drawdown from the week's high is the number that tends to be felt rather than read.
Ranges are resolved on the close, not on the wick, and the two can tell very different stories. A week can spend days outside the band and still settle inside it, which is why the log records one number and not the most dramatic one available.
Why the timestamps are the whole point
Zoom out for a second. This range was emitted on September 27, 2026 and resolves against the weekly close of October 4, 2026. Those two dates are not decoration. They are what separates a forecast from a comment, because once the first one passes the number cannot be edited.
Almost nobody in this corner of the internet publishes their errors. That is not a moral failing, it is an incentive: an unmarked forecast is always right in hindsight. The full record, including the ranges that missed, is public and dated, and it can be read as data rather than taken on trust.
The next number is already live
The next projected range is drawn over the live Bitcoin chart in the app, alongside the dated zones for the longer horizons, and it is recalculated on the server every day so that every visitor sees the same numbers. Nothing here is computed in your browser and nothing is personalised.
None of this is investment advice. It is one statistical model keeping its numbers where anybody can check them, including the weeks it gets wrong.
Frequently asked questions
Did Bitcoin close the week inside the projected range?
No. The range published in advance ran from $77,588 to $81,672 and the Bitcoin weekly close was $84,754, outside the band. The result joins the public track record either way.
Where is Bitcoin in its market cycle?
Day 898 since the last halving. The model uses that position as one of its signals, alongside recent volatility and the long-term trend.
Where can I see the full track record?
On the results page, with every checked projection, hits and misses alike. This piece's range, $77,588 to $81,672, ends up there too.
Published before the fact
Bitcoin dominance: – · Altseason: –
The 7, 30 and 90-day zones are checked on the free account; from six months to three years belongs to Pro. See the plans →