Bitcoin 30-day forecast checked: $84,025, inside the range
También disponible en español →
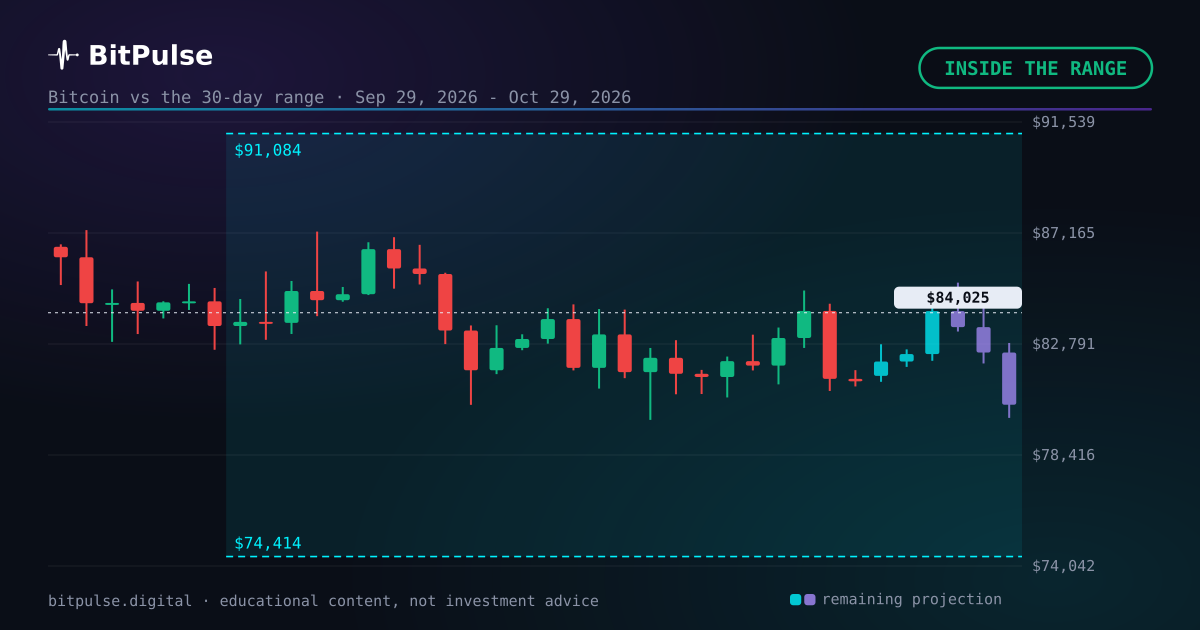
On September 29, 2026 the BitPulse model committed to a 30-day Bitcoin price range in public: $74,414 to $91,084, with Bitcoin at $83,244. The close that settled it, on October 22, 2026, was $84,025: inside the band, a hit. That makes 4 of 4 30-day ranges resolved inside so far, and 11 of 16 across every horizon.
Committed first, checked after: the verdict
On September 29, 2026 the model committed to a range of $74,414 to $91,084 for 30 days ahead, with Bitcoin trading at $83,244. The band was 20.1% wide edge to edge. Nothing in it moved after publication: the same two numbers sat on the chart and in the public log while the 30 days ran.
The number that settles a range is a daily close, and the one that settled this range came on October 22, 2026: $84,025. Measured against the centre of the band that is +1.5% away. The verdict: inside the band.
The previous verdict in this series: Bitcoin 30-day forecast checked: $83,457, inside the range. It stays published, hit or miss.
The range comes out of a four-model engine, reweighted every week against the real record. How it is calculated, step by step.
The 30-day scoreboard, updated
Zoom out for a second. With this result, 4 of the 4 30-day ranges resolved so far closed inside their band. Across every horizon the log reads 11 of 16. Both numbers are published the same way when they flatter the model and when they do not.
The band is the middle half of the model's distribution, so a well calibrated engine should land inside about half the time over many ranges. A streak of hits is no more proof of skill than a single miss is proof of failure: with few resolved ranges the count says little, and it is published anyway, because a record you only show when it looks good is not a record.
Short bands, long bands, different questions
A weekly range is mostly a statement about volatility: how far price can travel in seven days. A 30-day range asks a different question, one where the drift of the cycle, the funding regime and the slow on-chain signals start to matter as much as the noise. That is why the band is wider, 20.1% edge to edge here, and why one result at this horizon says less than one weekly result: there are far fewer of them.
Reading it right: the useful information is not whether this single range held, it is whether the proportion of hits over many ranges stays close to the half that the middle band promises. Too many hits means the band is too wide to be useful; too few means the engine is missing something.
How far price travelled in 30 days
Set the price aside for a moment. Between the low of $79,800 and the high of $87,220 there was 9.3% of ground. Of the 24 daily closes in the period, 24 landed inside the band and 0 outside; from the price at commitment to the settling close, Bitcoin moved +0.9%.
Ranges are resolved on closes, not on wicks, and a 30-day period can spend weeks outside the band and still settle inside it, or the other way round. This one settled on October 22, 2026, before its nominal expiry of October 29, 2026: the checking window opens 7 days early and the first close inside counts.
The checking window, explained
A 30-day range carries a checking window of 7 days on each side of its expiry date, October 29, 2026 for this one. From the day the window opens, the first daily close that lands inside the band resolves the range as a hit. If the window closes without one, the close of the expiry day is recorded and the range counts as a miss.
Only closed candles count, and nothing is rewritten afterwards: the emission date, the band, the settling close and the verdict stay in the log as they were. Weekly ranges follow a stricter rule and open their window only at expiry, which is why they are told in the Sunday piece and the longer horizons here.
The next number is already live
Context first, verdict after. The next projected range is drawn over the live Bitcoin chart in the app, alongside the dated zones for the longer horizons, and it is recalculated on the server every day so that every visitor sees the same numbers. Nothing here is computed in your browser and nothing is personalised.
None of this is investment advice. It is one statistical model keeping its numbers where anybody can check them, including the weeks it gets wrong.
Frequently asked questions
Did Bitcoin stay inside the projected 30-day range?
Yes. The range committed on September 29, 2026 ran from $74,414 to $91,084, and the close that settled it on October 22, 2026 was $84,025, inside the band. So far 4 of 4 30-day ranges resolved inside.
Where can I see the full track record?
On the results page, with every checked projection, hits and misses alike. This piece's range, $74,414 to $91,084, ends up there too.
How wide was the projected range?
20.1% between its edges, from $74,414 to $91,084. The narrower it is, the more the model commits: a wide range is almost always right and tells you nothing.
Published before the fact
Bitcoin dominance: – · Altseason: –
The 7, 30 and 90-day zones are checked on the free account; from six months to three years belongs to Pro. See the plans →