Strategy holds 840,447 BTC and trades at 65% of them
También disponible en español →
Strategy (MSTR) holds 840,447 bitcoin, about 4.00% of every coin that will ever exist. At Wednesday's close the whole company was worth 0.65 times that pile: less than the bitcoin it owns. Here is what the numbers say, updated every Thursday.
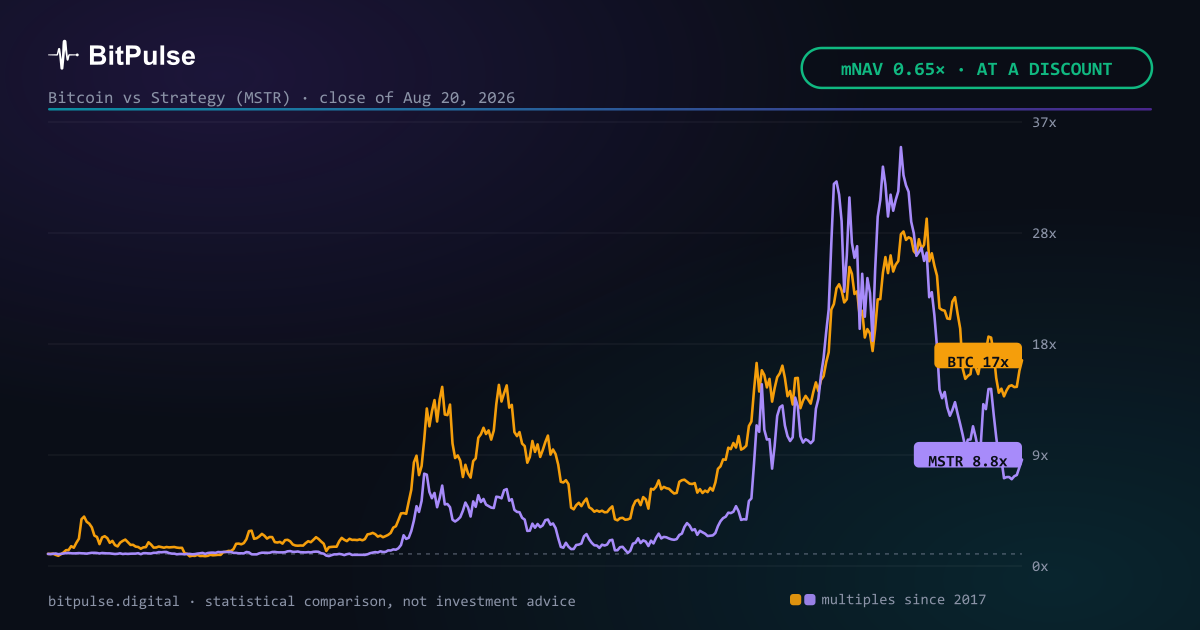
The mNAV, and what it actually says
The bitcoin on Strategy's balance sheet is worth 61.4 billion dollars at the latest close. The whole company, every share included, is worth 39.6 billion dollars. Divide one by the other and you get the mNAV: 0.65x.
Below 1 means the stock trades for less than the bitcoin it owns. Put bluntly, the market is pricing every dollar of bitcoin on that balance sheet at 0.65 dollars. That discount is not free money: it exists because a company is not a wallet, and the sections below are the reasons the market gives for it.
The pile, and the price they paid for it
840,447 bitcoin, around 4.00% of every coin that will ever exist. No other listed company is close, and the figure comes from official filings rather than from an estimate.
They paid an average of $76,029 per coin. With Bitcoin at $73,025, that position sits -4.0% from its cost. Underwater, in plain words: the company is currently down on the bitcoin it bought. That number moves every day and it is the cleanest way to read the position without a story attached.
The debt behind the bitcoin, and when it comes due
Long-term debt stands at 6.7 billion dollars, which is 11 dollars owed for every 100 dollars of bitcoin held. Figures as of 2026-06-30, from the filings, so they move once a quarter rather than every day.
The first large maturity is 4.5 billion dollars. Debt is what separates this from simply owning coins: a wallet never has to refinance. It is also why the discount or premium on the mNAV is never just arithmetic.
The sources, and one honest caveat
Holdings, cost, debt and share count come from Strategy's own filings. Prices come from the daily closes of both assets. Nothing here is an estimate and nothing is rounded to make a point.
One caveat worth stating: the stock market closes and Bitcoin does not. These figures use the close of August 20, 2026, so the stock side is a day behind the coin side by construction. On a quiet week that changes nothing; on a violent one it is worth remembering before comparing the two.
What the public log says so far
6 of the 7 projected weekly ranges published so far resolved inside the band. Every one of them was frozen before its week, and every result went up afterwards, including the ones that went wrong.
There is a trap in that number worth naming. A band that contains the close every single time is not a good model, it is a wide one. The published band is the middle half of the distribution, so a properly calibrated engine should land inside about half the time. A hit rate far above that means the bands are wider than they should be, which is a miscalibration too, just the flattering kind.
Day 853 of the Bitcoin halving cycle
Counting days since the April 2024 halving puts this piece on day 853. The next halving is estimated by block height for April 10, 2028, a date that drifts with the real cadence of mined blocks rather than sitting on a calendar.
That count is the honest way to compare cycles, because what matters is not the date but how far in we are. It is also worth saying plainly that four halvings means four cases. Enough to see a shape, nowhere near enough to prove one, and whether the four year cycle still holds is an argument that is very much open. The cycle is context here, never the reason for a weekly number.
Are they still moving together?
The 30-day correlation reads 0.82, against 0.74 over five years. Read them together rather than one at a time: the long number says these two have shared a direction for years, and the short one says how tightly they are holding hands right now.
When the short reading drops well below the long one, something other than Bitcoin is driving the stock. It can be a filing, a financing, or the wider stock market having a bad week. That gap is the part worth watching.
Which of the two actually paid better
Over the last twelve months Bitcoin did -35.3% and MSTR did -66.6%. The coin won, by 31.3 points.
This is the question the whole panel exists to answer, and it deserves a blunt reading: holding bitcoin through a listed company adds leverage in both directions. When it works it beats the coin; when it does not, it loses by more. One year is one sample, and the honest way to use it is as one data point among several horizons, not as a verdict.
What this engine does not use
Worth being explicit, because the most searched Bitcoin models are not in this engine. There is no stock to flow here and no rainbow chart. Both are readable, both are popular, and both have spent the last cycle being argued about precisely because they were published as certainties and then had to be quietly re-drawn.
The power law is in, as one of the four generators, and it earns its place by being reweighted against real history every week rather than by looking convincing on a chart. Leaving the famous models out is not a dig at them. It is the same standard applied here: if a component cannot be scored against what actually happened, it does not get to move the band.
Where the line is
The BitPulse engine forecasts Bitcoin, and only Bitcoin. Everything on this page is a statistical comparison between two assets: no target price for the stock, no view on where it goes next, and no intention of adding one.
A company carries risks a currency does not. Debt that has to be refinanced, management decisions, regulation, and a share count that can change. None of this is investment advice, and a discount on the mNAV is a fact about today, not a promise about tomorrow.
Frequently asked questions
What is MSTR mNAV and why does it matter?
It is what the whole company is worth divided by what its bitcoin is worth. Today it reads 0.65x: the stock trades BELOW its reserves, so the market pays less than a dollar for every dollar of bitcoin on its balance sheet. It is the number that decides whether buying the stock is cheaper or dearer than buying the coin.
How is the Bitcoin range calculated?
With a combined engine of four models: a power law over a decade of price history, a Monte Carlo simulation driven by GARCH volatility, an Ornstein-Uhlenbeck residual model and an implied density read from the Deribit options surface. They are pooled into one distribution and reweighted every week against real history, with around fourteen live data sources feeding a bias layer on top. The published band is its middle half, frozen before the period starts so it cannot be adjusted after the fact.
Where is Bitcoin in its market cycle?
Day 853 since the last halving. The model uses that position as one of its signals, alongside recent volatility and the long-term trend.
Published before the fact
Bitcoin dominance: – · Altseason: –
The 7, 30 and 90-day zones are checked on the free account; from six months to three years belongs to Pro. See the plans →