Bitcoin weekly close: $81,250, outside the range
También disponible en español →
Every Sunday the BitPulse model commits to a range for the following week, in public and before the fact. The one that just expired said $72,499-$76,592; the market answered with a close at $81,250, outside it.
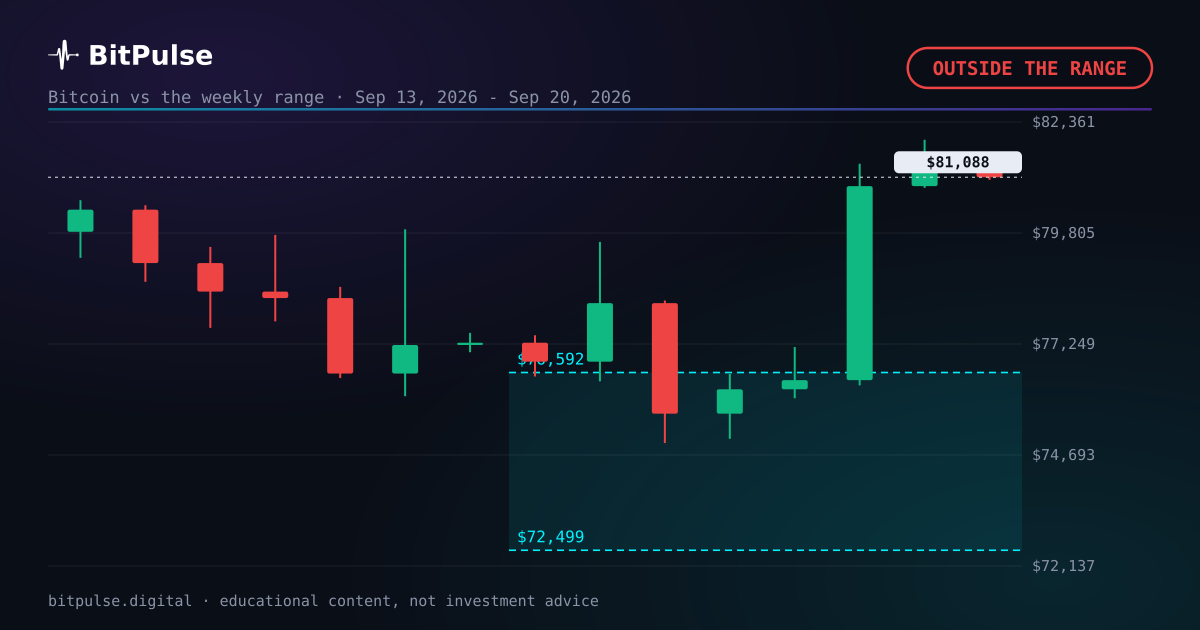
The week, from open to close
Bitcoin traded between a weekly low of $74,968 and a high of $81,951, and finished +5.7% from Monday's open. The number that settles the range is the close, and this week the close was $81,250.
Measured against the centre of the projected band, that landed +9.0% away, with official resolution still pending while the checker validates the close inside its window. The verdict: outside the band.
Last week, same series: Bitcoin weekly close: $77,263, inside the range. That range is already settled and published, hit or miss.
The range comes out of a four-model engine, reweighted every week against the real record. How it is calculated, step by step.
Day 884 of the Bitcoin halving cycle
Now the part most readers skip. Counting days since the April 2024 halving puts this piece on day 884. The next halving is estimated by block height for March 17, 2028, a date that drifts with the real cadence of mined blocks rather than sitting on a calendar.
That count is the honest way to compare cycles, because what matters is not the date but how far in we are. It is also worth saying plainly that four halvings means four cases. Enough to see a shape, nowhere near enough to prove one, and whether the four year cycle still holds is an argument that is very much open. The cycle is context here, never the reason for a weekly number.
When the market gets loud
A 5.7% move in seven days is the kind of week that fills timelines. On the way up it arrives with talk of buying the dip too late and of the next all time high. Both conversations are older than most of the accounts having them.
The band was sized before any of that happened, which is the only reason it is worth anything now. A model that reacts to the mood is just the mood with a chart attached.
The track record, out in the open
One layer deeper. Every weekly range on this site is committed in advance and checked against the real close, in public, on the Results page. So far 9 of the last 11 resolved weekly ranges closed inside the committed band. Chance alone would expect about half.
The number is published the same way when it flatters the model and when it does not, because a track record you only show when it looks good is marketing, not a record. Each entry keeps its emission date, its band and the close it was checked against, so anyone can audit any week.
How far Bitcoin travelled to get nowhere
Zoom out for a second. Between the weekly low of $74,968 and the high of $81,951 there is 9.3% of ground, and the close ended 0.9% below the top of that span. The drawdown from the week's high is the number that tends to be felt rather than read.
Ranges are resolved on the close, not on the wick, and the two can tell very different stories. A week can spend days outside the band and still settle inside it, which is why the log records one number and not the most dramatic one available.
Where this goes from here
The next projected range is drawn over the live Bitcoin chart in the app, alongside the dated zones for the longer horizons, and it is recalculated on the server every day so that every visitor sees the same numbers. Nothing here is computed in your browser and nothing is personalised.
None of this is investment advice. It is one statistical model keeping its numbers where anybody can check them, including the weeks it gets wrong.
Frequently asked questions
Did Bitcoin close the week inside the projected range?
No. The range published in advance ran from $72,499 to $76,592 and the Bitcoin weekly close was $81,250, outside the band. The result joins the public track record either way.
How much did Bitcoin move this week?
+5.7% from the open, with a high of $81,951 and a low of $74,968. The projected range covered $72,499 to $76,592.
How is the Bitcoin range calculated?
With a combined engine of four models: a power law over a decade of price history, a Monte Carlo simulation driven by GARCH volatility, an Ornstein-Uhlenbeck residual model and an implied density read from the Deribit options surface. They are pooled into one distribution and reweighted every week against real history, with around fourteen live data sources feeding a bias layer on top. The published band is its middle half, frozen before the period starts so it cannot be adjusted after the fact.
Published before the fact
Bitcoin dominance: – · Altseason: –
The 7, 30 and 90-day zones are checked on the free account; from six months to three years belongs to Pro. See the plans →