Bitcoin price range this week: $77,588 to $81,672
También disponible en español →
The BitPulse model recalibrated on Sunday and committed its weekly range: $77,588 to $81,672 for the close on October 4, 2026, with Bitcoin trading around $83,643. The number is now frozen in the public log: whatever happens, the result gets published.
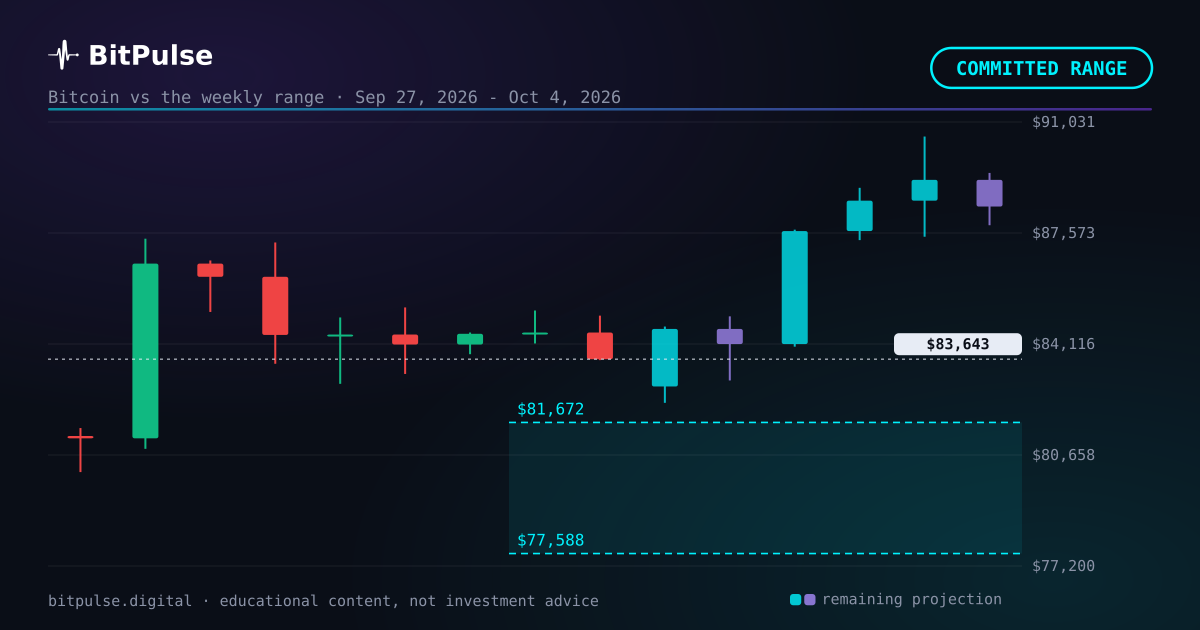
This week's projected Bitcoin range, in numbers
The committed band runs from $77,588 to $81,672, a width of 5.1%, and it resolves against the Bitcoin weekly close of October 4, 2026.
Its centre sits -0.8% from the price at the moment it was emitted. That one figure is the model's entire weekly lean, with no narrative wrapped around it: this week it tilts downward.
Last week, same series: Bitcoin weekly forecast: $74,748 to $79,132. That range is already settled and published, hit or miss.
The range comes out of a four-model engine, reweighted every week against the real record. How it is calculated, step by step.
How the committed ranges have actually done
Set the price aside for a moment. Every weekly range on this site is committed in advance and checked against the real close, in public, on the Results page. So far 9 of the last 12 resolved weekly ranges closed inside the committed band. Chance alone would expect about half.
The number is published the same way when it flatters the model and when it does not, because a track record you only show when it looks good is marketing, not a record. Each entry keeps its emission date, its band and the close it was checked against, so anyone can audit any week.
The cycle backdrop, one step out
Counting days since the April 2024 halving puts this piece on day 892. The next halving is estimated by block height for April 25, 2028, a date that drifts with the real cadence of mined blocks rather than sitting on a calendar.
That count is the honest way to compare cycles, because what matters is not the date but how far in we are. It is also worth saying plainly that four halvings means four cases. Enough to see a shape, nowhere near enough to prove one, and whether the four year cycle still holds is an argument that is very much open. The cycle is context here, never the reason for a weekly number.
What the width of the band says about Bitcoin volatility
Context first, verdict after. The band is 5.1% wide between its edges. That single figure is the model stating, in advance, how much weekly movement it considered ordinary for Bitcoin right now. Wider bands mean the engine sees a jumpier market; narrower ones mean it is willing to commit.
It is a more useful reading than it looks, because it is the part of a forecast that people usually skip. A narrow band that holds is a real result. A wide band that holds proves very little, and the width is published precisely so nobody has to take the hit rate at face value.
Hits and misses, published the same size
Now the part most readers skip. 9 of the 12 projected weekly ranges published so far resolved inside the band. Every one of them was frozen before its week, and every result went up afterwards, including the ones that went wrong.
There is a trap in that number worth naming. A band that contains the close every single time is not a good model, it is a wide one. The published band is the middle half of the distribution, so a properly calibrated engine should land inside about half the time. A hit rate far above that means the bands are wider than they should be, which is a miscalibration too, just the flattering kind.
The next number is already live
The next projected range is drawn over the live Bitcoin chart in the app, alongside the dated zones for the longer horizons, and it is recalculated on the server every day so that every visitor sees the same numbers. Nothing here is computed in your browser and nothing is personalised.
None of this is investment advice. It is one statistical model keeping its numbers where anybody can check them, including the weeks it gets wrong.
What is on the calendar
- US payrolls
The projection does NOT use this data. We measured it: a macro release moves Bitcoin by one or two points over ten days, while Bitcoin’s own swing over that same window is close to thirteen. It drowns, so adding it would decorate the model rather than improve it. This is here as context.
Frequently asked questions
What is the projected Bitcoin price range for this week?
From $77,588 to $81,672, committed in advance and resolved against the weekly close of October 4, 2026. It is the central band of simulated scenarios, not a price target.
Is this a Bitcoin price prediction?
No. It is a projected price range: the central band of thousands of simulated scenarios, published before the fact and checked after. Here it covered $77,588 to $81,672. It is educational content and it can fail; it is not investment advice.
How wide was the projected range?
5.1% between its edges, from $77,588 to $81,672. The narrower it is, the more the model commits: a wide range is almost always right and tells you nothing.
Published before the fact
Bitcoin dominance: – · Altseason: –
The 7, 30 and 90-day zones are checked on the free account; from six months to three years belongs to Pro. See the plans →