Is MSTR a cheap way to own bitcoin? mNAV says 0.80x
También disponible en español →
One number decides whether buying Strategy is a cheap way to own bitcoin: the mNAV, what the market pays for the company against what its bitcoin is worth. This week it reads 0.80x, with Bitcoin at $84,398 and MSTR at $162.
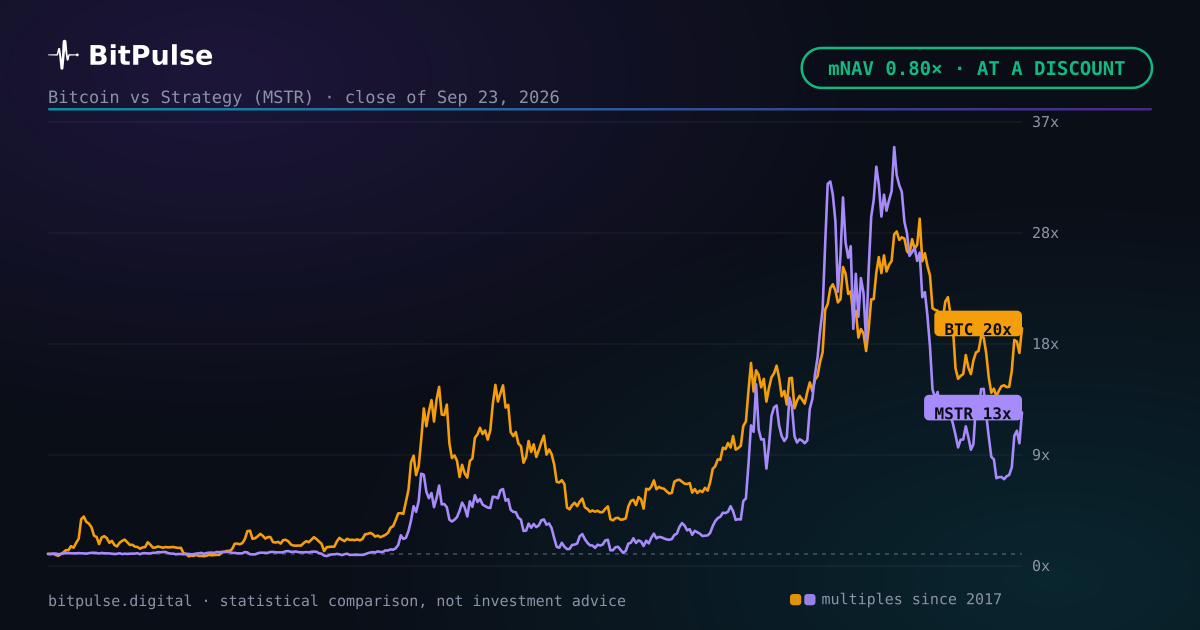
What the market pays for Strategy against its bitcoin
The bitcoin on Strategy's balance sheet is worth 71.3 billion dollars at the latest close. The market prices the entire firm, every share counted, at 57.2 billion dollars. Divide one by the other and you get the mNAV: 0.80x.
Below 1 means the stock trades for less than the bitcoin it owns. Put bluntly, the market is pricing every dollar of bitcoin on that balance sheet at 0.80 dollars. That discount is not free money: it exists because a company is not a wallet, and the sections below are the reasons the market gives for it.
Last week, same series: Is MSTR a cheap way to own bitcoin? mNAV says 0.69x. That range is already settled and published, hit or miss.
The range comes out of a four-model engine, reweighted every week against the real record. How it is calculated, step by step.
Microstrategy bitcoin holdings, and what they cost
845,050 bitcoin, around 4.02% of every coin that will ever exist. No other listed company is close, and the figure comes from official filings rather than from an estimate.
They paid an average of $76,052 per coin. With Bitcoin at $84,398, that position sits +11.0% from its cost. In profit, in plain words: the company is currently up on the bitcoin it bought. That number moves every day and it is the cleanest way to read the position without a story attached.
The correlation, near and far
Context first, verdict after. The 30-day correlation reads 0.83, against 0.74 over five years. Read them together rather than one at a time: the long number says these two have shared a direction for years, and the short one says how tightly they are holding hands right now.
When the short reading drops well below the long one, something other than Bitcoin is driving the stock. It can be a filing, a financing, or the wider stock market having a bad week. That gap is the part worth watching.
MSTR vs Bitcoin over the last year
Now the part most readers skip. Over the last twelve months Bitcoin did -25.1% and MSTR did -51.7%. The coin won, by 26.6 points.
This is the question the whole panel exists to answer, and it deserves a blunt reading: holding bitcoin through a listed company adds leverage in both directions. When it works it beats the coin; when it does not, it loses by more. One year is one sample, and the honest way to use it is as one data point among several horizons, not as a verdict.
MSTR beta: how much it moves per point of Bitcoin
Over the last 90 trading days the beta is 1.76x. For every point Bitcoin moves, MSTR has moved 1.76 points on average. Daily volatility says the same thing from another angle: 2.9% for Bitcoin against 6.3% for the stock, a ratio of 2.17x.
Both figures are computed only on days when both actually traded. Bitcoin trades on weekends and MSTR does not, and comparing the two without lining up the calendar invents correlation that is not there.
The forecast is for Bitcoin, not for MSTR
One layer deeper. The BitPulse engine forecasts Bitcoin, and only Bitcoin. Everything on this page is a statistical comparison between two assets: no target price for the stock, no view on where it goes next, and no intention of adding one.
A company carries risks a currency does not. Debt that has to be refinanced, management decisions, regulation, and a share count that can change. None of this is investment advice, and a discount on the mNAV is a fact about today, not a promise about tomorrow.
Frequently asked questions
What is MSTR mNAV and why does it matter?
It is what the whole company is worth divided by what its bitcoin is worth. Today it reads 0.80x: the stock trades BELOW its reserves, so the market pays less than a dollar for every dollar of bitcoin on its balance sheet. It is the number that decides whether buying the stock is cheaper or dearer than buying the coin.
Is this a Bitcoin price prediction?
No. It is a projected price range: the central band of thousands of simulated scenarios, published before the fact and checked after. Here it covered $NaN to $NaN. It is educational content and it can fail; it is not investment advice.
How is the Bitcoin range calculated?
With a combined engine of four models: a power law over a decade of price history, a Monte Carlo simulation driven by GARCH volatility, an Ornstein-Uhlenbeck residual model and an implied density read from the Deribit options surface. They are pooled into one distribution and reweighted every week against real history, with around fourteen live data sources feeding a bias layer on top. The published band is its middle half, frozen before the period starts so it cannot be adjusted after the fact.
Published before the fact
Bitcoin dominance: – · Altseason: –
The 7, 30 and 90-day zones are checked on the free account; from six months to three years belongs to Pro. See the plans →